CPU activity at a glance
Choose a percentage, a bar or a graph. The CPU monitor shows usage across your Mac's total capacity, so the whole-machine reading stays between 0% and 100%.
Understand CPU usage → MacStatsBar
When your Mac feels busy, a quick look can help. Keep CPU and memory nearby, then add the readings you want to see. MacStatsBar gives you one clear place to choose.
Free. macOS 13 or later. No app account or subscription.
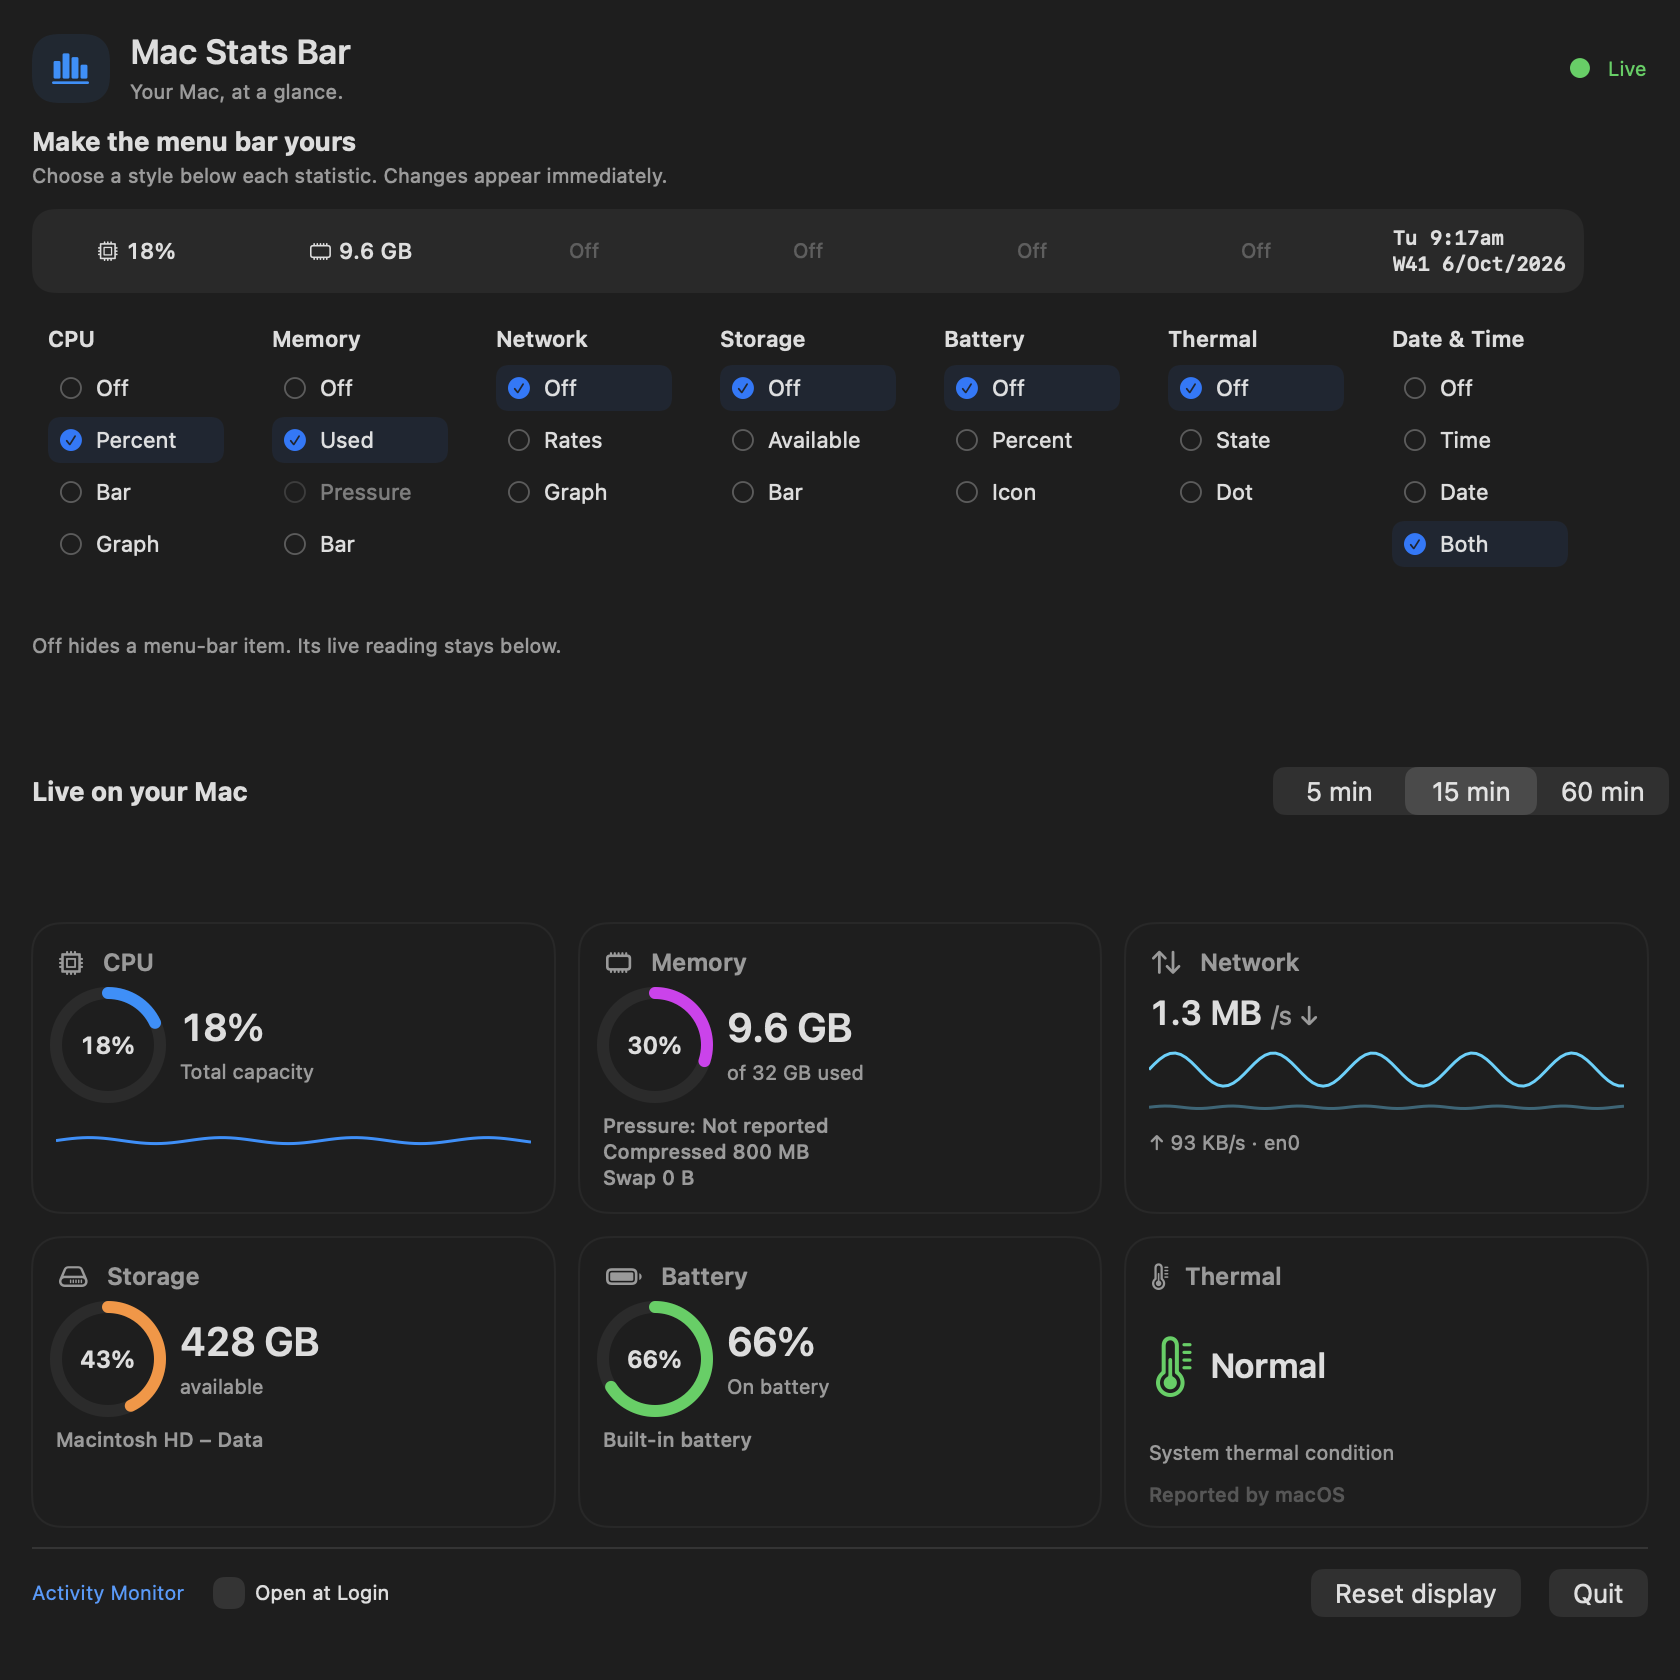
Example readings shown in the app. Your own readings appear on your Mac.
CPU and used memory start in your menu bar. Add another reading when it is useful, or choose Off to keep the bar compact. The live cards remain available in the app.
Choose a percentage, a bar or a graph. The CPU monitor shows usage across your Mac's total capacity, so the whole-machine reading stays between 0% and 100%.
Understand CPU usage →See estimated used memory, with compressed memory and swap shown separately. A high used-memory figure on its own does not mean your Mac is struggling.
Read memory more clearly →Watch download and upload rates for the active default-route interface. A traffic reading shows what is moving now; it is different from an internet speed test.
See what network rates mean →Keep available space on your Data volume and built-in battery charge in view. A desktop without a built-in battery shows Not present.
See Normal, Warm, Hot or Critical as reported by the system. MacStatsBar shows thermal condition rather than a temperature in degrees.
Understand the thermal reading →Add the time, date or both. The date display includes an ISO week number, and the clock follows your Mac's local time zone.
Each statistic has its own column of display choices. The live cards sit underneath, with recent CPU and network history. Pick a 5, 15 or 60-minute view when a little more context helps.
The app keeps system readings and display choices on your Mac. Recent history stays in memory for up to an hour. It does not send your system readings to a server.
Open at Login is optional. Reset display returns the menu bar styles to their defaults while keeping your history-window and login choices.
Read the privacy policy →Open Activity Monitor from MacStatsBar for process-level details. The menu bar gives you a quick overview; Activity Monitor helps you look at individual apps.
A monitor shows you what is happening. It does not automatically clean memory, speed up your Mac or change fan speeds.
MacStatsBar focuses on a compact overview and one page of controls. If you are comparing iStat Menus, iStatistica Pro or Stats, these guides explain the differences without adding another purchase to the decision.
Simple everyday readings, or more detailed monitoring tools.
Read the comparison →Menu bar or wider dashboardCompare the free overview with a broader monitoring suite.
Read the comparison →Two free approachesChoose around the readings and controls you want to use.
Read the comparison →MacStatsBar is free and available now. Leave your email to request the download link.
macOS 13 or later. No app account or subscription.
Yes. MacStatsBar is a free Mac system monitor with no app account or subscription required. It is available now. You can request the free download link on the homepage.
CPU, memory, network rates, available storage, built-in battery charge, thermal condition, and date or time. Each has its own display choices, including Off. CPU and used memory start visible; the other items start Off.
Yes, if you want a free overview of everyday system readings. MacStatsBar keeps setup and readings on one page. It does not include exact temperature sensors, fan control, GPU readings, per-process monitoring or remote dashboards. The comparison guides help you choose around the features you actually need.
It shows macOS thermal condition as Normal, Warm, Hot or Critical. It does not show CPU or GPU temperatures in degrees. The thermal guide explains this distinction so you can decide which kind of reading you want.
Off hides that item from the menu bar. Its live reading remains in the app below the display controls. You can keep the menu bar small and open the app when you want more detail.
Some readings need a fresh baseline, so the first CPU or network interval can be blank. Sleep and route changes can also leave gaps. Memory pressure stays unavailable until macOS reports a pressure event. A desktop can show Not present for the battery.
No. System readings and display choices stay on your Mac. Recent history is kept in memory for up to an hour. The website's optional download email and support form are separate from the app.
MacStatsBar requires macOS 13 or later. The app reads the information available from your Mac; hardware-dependent readings can be unavailable. The website screenshots show example data rather than measurements from your device.